Research Funding Grows: 2019 Survey
US Survey — Key Findings
Research institutions posted increased funding which could lead to the next generation of academic intellectual property, according to AUTM’s Annual Licensing Activity Survey, which polls US universities, hospitals and other research institutions.
The key findings of the 2019 US Survey:
- Total research expenditures grew to 77.2 billion, an increase of 7.7% over 2018, and a nearly 16% increase over the past five years.
- 25,392 disclosures were reported in 2019, a decrease of 3.1% from 2018.
- The US continues to be the primary market in which research institutions focus, with US patent applications accounting for approximately 62% of total filings.
- Technology transfer offices (TTOs) continue to license primarily to small companies as compared to large companies and startups. The reported share of licensing from small companies grew from 44.4% in 2015 to 58.7% in 2019.
- 1,040 start-ups were formed in 2019, directly impacting local economies, with more than 73% of the new businesses remaining in their institution’s home state.
- Take a closer look at how tech transfer operations tick for different peer groups in the report's benchmarking section.
US Survey — Purchase
Canadian Survey — Key Findings
Research institutions posted increased funding which could lead to the next generation of academic intellectual property, according to AUTM’s Annual Licensing Activity Survey, which polls Canadian universities, hospitals and other research institutions.
The key findings of the 2019 Canadian Survey:
- Total research expenditures grew to 6.45 billion, an increase of 6.6% over 2018.
- 1,743 disclosures were reported in 2019, a decrease of 7.5% increase over the past five years.
- New US utility patent applications grew to 90 in 2019, a 52% increase over the prior year.
- The number of licences and options handled per licensing staff has more than doubled over the past decade, increasing from 2.65 licences and options per licensing staff in 2010 to 5.61 in 2019.
- 118 start-ups were formed in 2019, directly impacting local economies, with more than 90% of the new businesses remaining in their institution’s home province.
- Take a closer look at how tech transfer operations tick for different peer groups in the report's benchmarking section.
Canadian Survey — Purchase
Our Latest Infographic
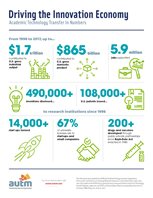  |
Discover how academic technology transfer is driving the innovation economy and benefiting society.
Download and share this infographic.
|
Customizable Infographic
_life-cycle?width=153&height=198) |
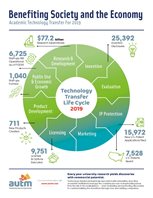
Share your tech transfer office's impact data with this customizable infographic: Just add your numbers to the blank tech transfer life cycle.
Download the fillable infographic for your own use. |
Search More than 29 Years of Data
View the data online via STATT (Statistics Access for Technology Transfer), a searchable database of nearly three decades of data. All members whose institutions participated in the 2019 survey receive a free annual subscription to STATT. Members from non-participating institutions can purchase an annual subscription of STATT.
Survey Pricing
| AUTM Member Status |
Publication |
Price |
| Members from Contributing Institutions |
Survey Data |
Free |
| Members from Non-contributing Institutions |
Survey Data |
$50 |
| Non-members |
Survey Data |
$375 |
STATT Database Pricing
| AUTM Member Status |
STATT Product |
Price |
| Members from Contributing Institutions |
One-year Subscription |
Free |
| Members from Non-contributing Institutions |
One-year Subscription |
$225 |
| Non-members |
One-year Subscription |
$525 |